

Introduction:
The original Aero Base Layer revolutionised performance cycling. However, this it was designed to perform between the 35-50kph speed range. This is ideal for most road and TT riders, but for road sprinters, track racers and maybe the elite of the TT world, this isn’t fast enough. We needed something tailored for 50kph+.
The theory behind how the two layer aero technologies work predicts that different rib spacing will differently at different speeds. This is how we narrowed down rib spacings to test in the original Aero Base Layer. New, different rib spacings could therefor yield even greater gains at higher speeds. This led to further research and development to create a new base layer optimized for speeds exceeding 50kph.

Testing of the original Aero Base Layer Prototypes
Prototype Selection:
Ten prototypes were developed, featuring custom fabrics with a range of rib spacings.
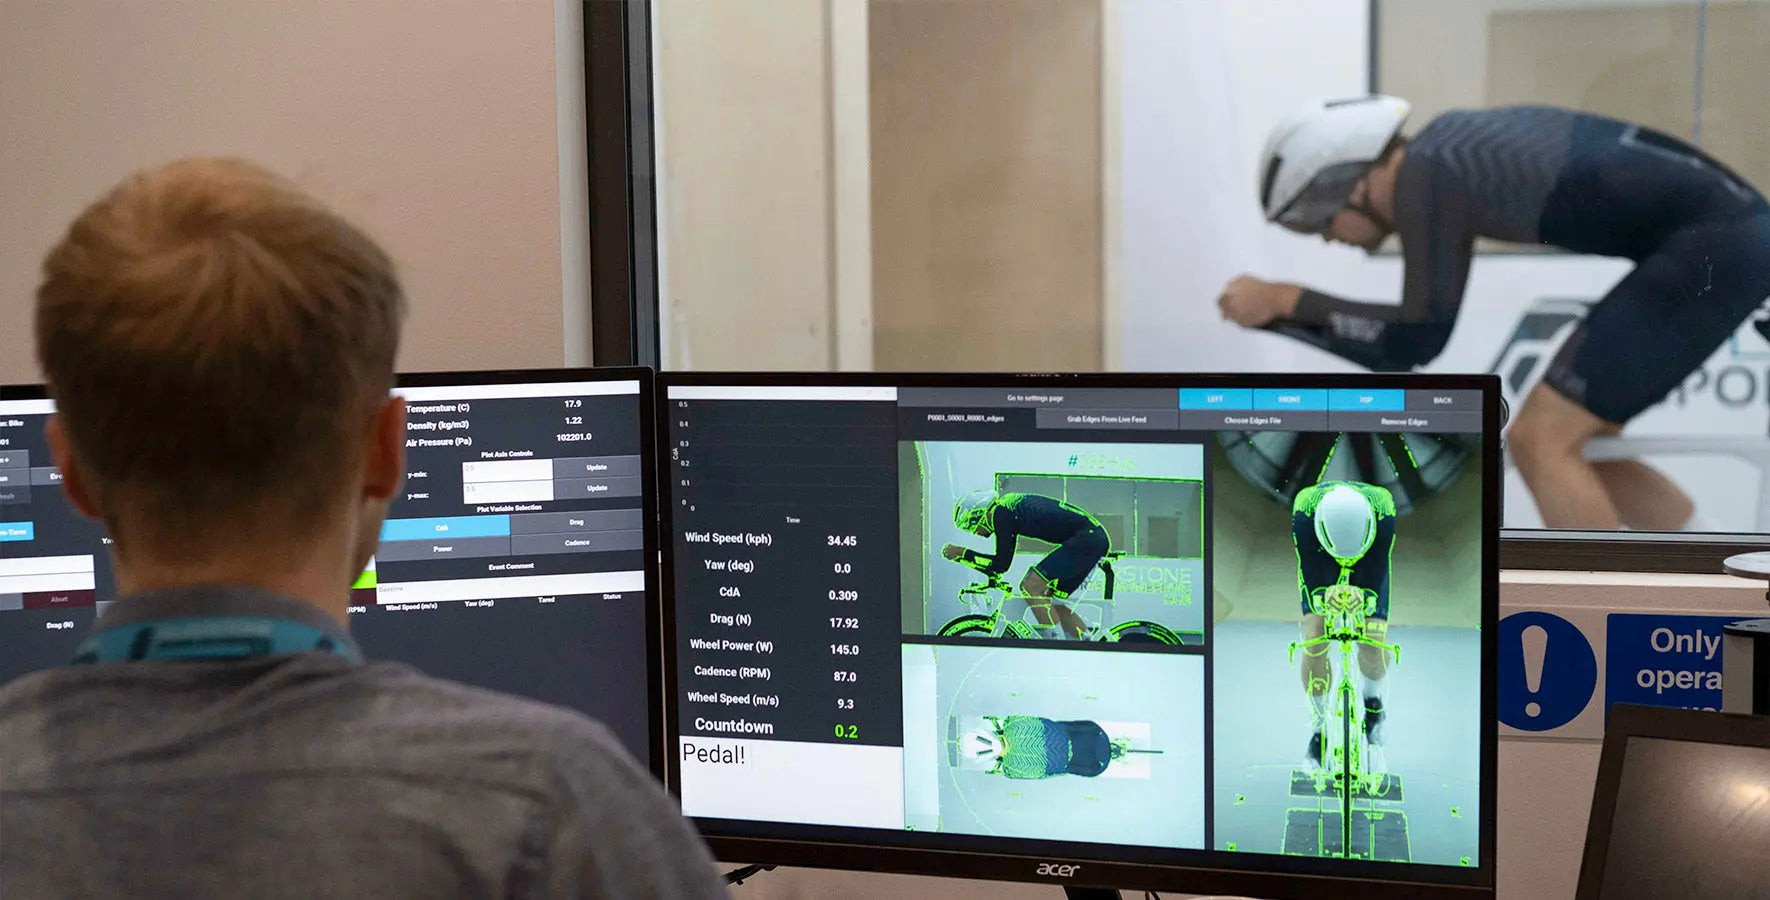
These prototypes were tested alongside the original Aero Base Layer using Olympic track sprinter, Jean Spies, in the Silverstone Sports Engineering Hub Wind Tunnel.
Consistent positions and cadences were maintained during multiple test runs to ensure reliable and repeatable data capture.
Original Test Runs:
Test runs were conducted through a speed range of 35-70kph to identify the transition point between the original and new fabrics in terms of optimal drag reduction. Our 'original' Aero Base Layer would be our baseline used to compare the prototype to. For the sake of understanding, in this article we will refer to it as the 'Low Speed' Aero Base Layer.
Raw Numbers
| Speed (kph) | ||||||||
| Kit on Test | 35 | 40 | 45 | 50 | 55 | 60 | 65 | 70 |
| Low Speed Base Layer | 144.64 | 220.16 | 302.73 | 405 | 534.68 | 698.29 | 875.7 | 1092.9 |
| Base Layer Prototype 1 | 157.4 | 224.15 | 307.13 | 410.53 | 540.33 | 685.49 | 852.36 | 1061.42 |
| Base Layer Prototype 2 | 158.47 | 230.58 | 321.02 | 418.63 | 543.58 | 686.16 | 861.64 | 1065.83 |
| Base Layer Prototype 3 | 158.61 | 232.76 | 324.22 | 435.49 | 570.65 | 722.24 | 898.56 | 1111.25 |
| Base Layer Prototype 4 | 159.49 | 231.34 | 316.57 | 423 | 533.73 | 697.57 | 859.18 | 1050.79 |
| Base Layer Prototype 5 | 158.6 | 229.77 | 303.56 | 399.6 | 520.92 | 673.99 | 851.02 | 1065.36 |
| Base Layer Prototype 6 | 161.7 | 231.47 | 316.32 | 417.26 | 544.87 | 690.1 | 880.32 | 1081.02 |
| Base Layer Prototype 7 | 152.42 | 221.01 | 310.07 | 412.67 | 541.42 | 686.77 | 864.76 | 1078.75 |
| Base Layer Prototype 8 | 155.35 | 228.68 | 305.61 | 412.1 | 541.35 | 691.02 | 881.53 | 1100.3 |
| Base Layer Prototype 9 | 155.52 | 220.07 | 309.12 | 413.19 | 538.38 | 692.7 | 881.5 | 1096.19 |
| Base Layer Prototype 10 | 157.53 | 222.74 | 303.8 | 408.13 | 535.15 | 697.11 | 877.56 | 1089.81 |
Watts Saved Vs. 'Low Speed' Aero Base Layer
| Speed | ||||||||
| 35 | 40 | 45 | 50 | 55 | 60 | 65 | 70 | |
| Base Layer Prototype 1 | -12.76 | -3.99 | -4.4 | -5.53 | -5.65 | 12.8 | 23.34 | 31.48 |
| Base Layer Prototype 2 | -13.83 | -10.42 | -18.29 | -13.63 | -8.9 | 12.13 | 14.06 | 27.07 |
| Base Layer Prototype 3 | -13.97 | -12.6 | -21.49 | -30.49 | -35.97 | -23.95 | -22.86 | -18.35 |
| Base Layer Prototype 4 | -14.85 | -11.18 | -13.84 | -18 | 0.95 | 0.72 | 16.52 | 42.11 |
| Base Layer Prototype 5 | -13.96 | -9.61 | -0.83 | 5.4 | 13.76 | 24.3 | 24.68 | 27.54 |
| Base Layer Prototype 6 | -17.06 | -11.31 | -13.59 | -12.26 | -10.19 | 8.19 | -4.62 | 11.88 |
| Base Layer Prototype 7 | -7.78 | -0.85 | -7.34 | -7.67 | -6.74 | 11.52 | 10.94 | 14.15 |
| Base Layer Prototype 8 | -10.71 | -8.52 | -2.88 | -7.1 | -6.67 | 7.27 | -5.83 | -7.4 |
| Base Layer Prototype 9 | -10.88 | 0.09 | -6.39 | -8.19 | -3.7 | 5.59 | -5.8 | -3.29 |
| Base Layer Prototype 10 | -12.89 | -2.58 | -1.07 | -3.13 | -0.47 | 1.18 | -1.86 | 3.09 |

Performance Below 50kph:
The original Aero Base Layer proved to be the best performer for speeds below 50kph, reaffirming its effectiveness for road racing and time trailing. Prototypes 4 and 5 displayed the most promise during initial testing and were selected to be tested at further speeds and yaw angles. Prototype 1 showed significant drag reduction at 70kph but performed poorly at lower speeds, leading to its exclusion from further testing.

Secondary Testing:
Prototypes 4 and 5 were then subjected to secondary testing at speeds of 50-75kph and two yaw angles (0 and 2.5) to replicate velodrome conditions.
| Yaw 0 | ||||||
| Speed (kph) | ||||||
| 50 | 55 | 60 | 65 | 70 | 75 | |
| Low Speed Base Layer | 434.5 | 576.3 | 753.56 | 959.74 | 1202.37 | 1480.72 |
| Base Layer 4 | 453.7 | 588.87 | 752.93 | 938.98 | 1155.95 | 1418 |
| Base Layer 5 | 429.68 | 560.36 | 719.4 | 910.1 | 1135.45 | 1405.74 |
| Yaw 2.5 | ||||||
| Speed (kph) | ||||||
| 50 | 55 | 60 | 65 | 70 | 75 | |
| Low Speed Base Layer | 430.18 | 576.31 | 733.38 | 932.35 | 1159.33 | 1434.013 |
| Base Layer 4 | 448.04 | 581.65 | 748.54 | 938.98 | 1160.675 | 1418.57 |
| Base Layer 5 | 420.33 | 549.15 | 707.56 | 900.83 | 1126.53 | 1397.38 |


Final Results:
Prototype 5 emerged as the clear winner.
Prototype 5 consistently outperformed Prototype 4 at all speeds and yaw angles during secondary testing. Any concerns regarding Prototype 4's potential superiority at speeds above 70kph were nullified by the data collected.
Based on the results, Option 5 was selected as the winning design and is now available as the High-Speed Aero Base Layer.
Conclusion:
Through rigorous testing and development, the High-Speed Aero Base Layer was created to cater to the specific needs of road sprinters and track racers operating at speeds exceeding 50kph. The innovative rib spacing design ensures optimal performance and drag reduction in this speed range, enhancing the overall efficiency of athletes in high-speed scenarios.
Prototype 5 is available now as our High Speed Base Layer.
Most Popular
newest productsshop all